The formula for economic development and curing poverty is well known: Security of property rights, low taxes, reasonably free trade and stable and readily convertible currency — the economic policy that has been demonstrated to be highly successful in moving countries from third world to first world
In the past century there has been an enormous improvement in human well being, almost all of it from economic development, almost none of it from redistribution. The most extreme exercises in redistribution created gigantic suffering, and resulted in the murder of about a hundred million people.
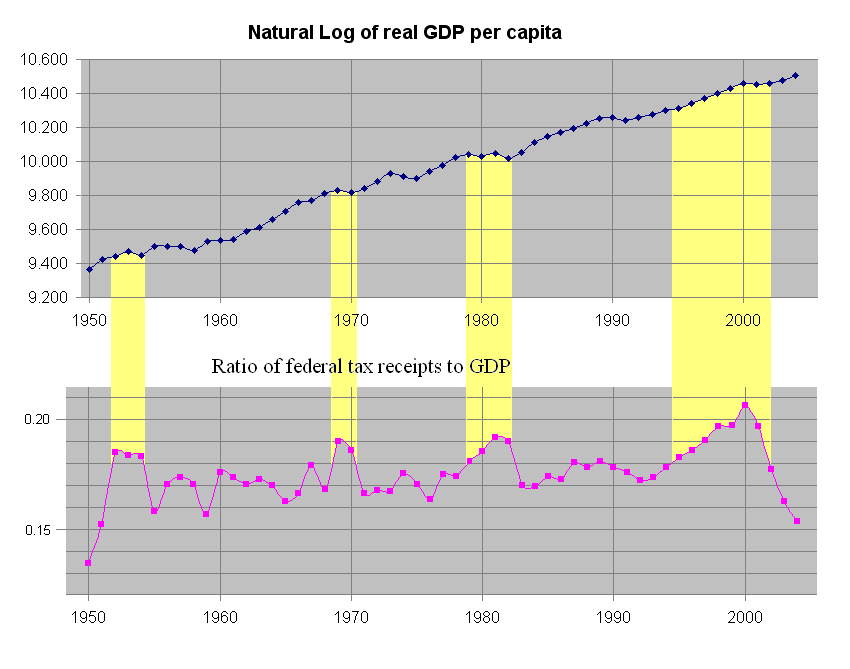
The question then is: Are taxes dangerously high in the advanced countries as well? Are taxes so high that cutting taxes will, in few years, increase the returns to the government? This is derided as “voodoo economics”, yet it is fairly obvious that ruinous taxation is a major part of why the third world is third world. Is then taxation also keeping the first world much poorer than it would otherwise be? For the United States, I defined “high taxes” as the federal government taking more than 18.1% of GDP, for during the Reagan Revolution, the archetype of “voodoo economics” the largest portion of GDP taken by the federal government was slightly more than 18%. Alternatively, I defined “a high taxes period” as any period where the federal government took substantially and persistently more than 18% of GDP.
High tax periods highlighted in yellow

Nominal GDP and real GDP per head from eh.net/hmit/gdp/. Federal receipts from page 22 of http://www.whitehouse.gov/omb/budget/fy2005/pdf/hist.pdf. Calculations in Excel spreadsheet here.
I graph the natural log of GDP, rather than the actual GDP, so that you can read the growth rate directly from the slope of the graph: For example in 1983, first year of the Reagan tax cuts, log of GDP is 10.052, and in 1989, last year of the Reagan presidency, log of GDP is 10.250, so the log increased 0.198 in six years, 0.198/6= 0.033, so during those years GDP growth was 3.3% a year.
Average growth during high tax periods was 1.08%, average growth during normal times was 2.45%. Every high tax period was a long period of economic stagnation, malaise, or decline or else contained a long period of decline. Such events were rare during normal tax periods.
The graph suggests that taxes are well and truly on the wrong side of the Laffer curve — that increasing taxes will lead to decreased revenue after a fairly short period — at least if federal taxes seize more than 18.1% of GDP
Of course, this depends on who you tax, which the data I had available do not reveal. I suspect that if you tax the poor good and hard with heavy taxes on petrol, beer, and cigarettes, like those wonderfully redistributive welfare states in europe, you can collect a lot more than 18.1% of GDP without the economy going down the drain, for such taxes will cause the poor to work harder, while progressive taxes are likely to cause the rich to go underground, or retire to house on a hill overlooking the Coral Sea, unless, like certain progressive European countries, you have a few little loopholes here and there so that you can get the political credit for soaking the rich, without actually soaking them so much as to sink the economy.
Growth for the first three high tax periods was negative – possibly because they were trying to soak the rich, unlike Clinton, possibly because they did not have the internet boom increasing their revenues and boosting growth, unlike Clinton, possibly because Clinton “ended welfare as we know it”, whereas the early high tax periods were great society taxes. We really need statistics giving a breakdown on who is paying taxes to distinguish between these possibilities. We also need statistics giving hints as to who is goofing off and going underground. In third world countries it is largely the poor who go underground, which is consistent with the conjecture that it was “ending welfare as we know it” that made the difference, but the Reagan experience suggests that what smacks down the economy is high taxes on the rich, who have the option of fleeing or retiring.

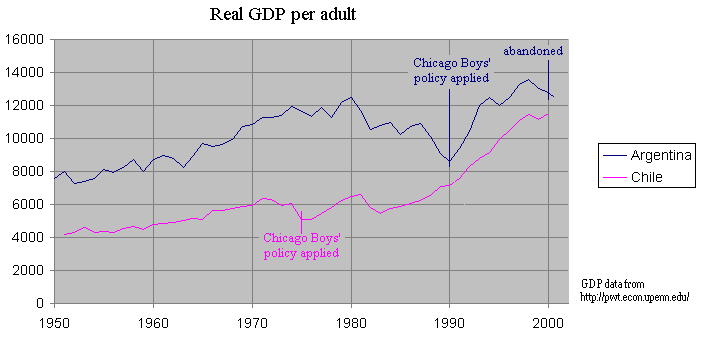
It is difficult to say exactly when the Chicago Boys' policy's began to be implemented in Chile, for implementation began over a decade, with Chicago trained economists being appointed here and there from time to time. To avoid the accusation of cherry picking dates, in the way that those trying to argue these policies were a failure cherry pick dates, (sometimes cherry picking dates that are a decade or several decades removed from the policies in question) I have chosen the appointment of a minister of property as the defining moment, for property rights in the means of production are the center of the Chicago Boys' program, and every element of that program is some aspect of property rights.
Christina D. Romer and David H. Romer in “ the Macroeconomic Effects of Tax Changes: Estimates based on a new measure of fiscal shocks” find an approximately similar result using a different measure of taxation. They consider announcements of tax changes, rather than the proportion of GDP taken in taxes. They find that an announced tax change equivalent to one percent of GDP causes a three percent reduction in GDP over the next two and half years, which would indicate that we are approximately at the Laffer maximum - that increases and decreases in taxes do not have a long term effect on revenue, that increasing taxes merely increases the relative status of people in the state sector by reducing the absolute wealth of people outside the state sector, without increasing the absolute wealth of people in the state sector.